A couple of years ago I had a chance meeting with a cartographer in North Dakota. It was interesting because he asked us (a group of linguists) What is a language or linguistic map? So, I grabbed a few examples and put them into a brief for him. This past January at the LSA meeting in Portland, Oregon, I had several interesting conversations with the folks at the LL-Map Project under Linguists’ List. It occurred to me that such a presentation of various kinds of language maps might be useful to a larger audience. So this will be a bit unpolished but should show a wide selection of language and linguistic based maps, and in the last section I will also talk a bit about interactive maps. I am not a cartographer but I am an avid user of maps, and web-based cartography tools. My experience ranges from collecting National Geographic maps since I was in the third grade to using aeronautical charts in flight school and to collaborating to create some maps for various uses in a language documentation project. The beauty and goal of any map is to reveal to the viewer a story. In the process of viewing the story to also help the viewer to make new associations and to interpret or relate complex data which is otherwise out of perspective and therefore also out of comprehension. In this sense cartographers, or map makers must also consider the usability of their maps, and the total user experience [1] Hugh Paterson III. 10 November 2011. Diving into the UX World. Blog post on thejourneyler.org. https://hugh.thejourneyler.org/2011/diving-into-the-ux-world/. [Link] [Accessed: 27 February 2012] . There are several interesting articles about the user experience and design side of map making in the Winter 2012 Edition of ArcUser by ESRI. One, Less is more, [2] ESRI. 2012. Less is more. Winter 2012 Edition of ArcUser. http://www.esri.com/news/arcuser/0112/less-is-more.html. [Link] [PDF] [Accessed: 27 February 2012] talks about using colors which do not compete for the readers attention. Another, Make Maps People Want to Look At [3]Aileen Buckley. 2012. Make Maps People Want to Look At. Winter 2012 Edition of ArcUser. http://www.esri.com/news/arcuser/0112/make-maps-people-want-to-look-at.html. [Link] [PDF] [Accessed: 27 … Continue reading talks about how to frame maps, and how to use icons people can easily compare for meaning. One final mention from ESRI’s winter 2012 edition is an interview with Dr. Anja Hopfstock. As she and ESRI talk about infrastructure design for interoperability of data and usability of maps within the context of building infrastructure for sharing across the European Union. [4]Karen Richardson. 2012. The Importance of Cartographic Design in the SDI environment. Winter 2012 Edition. http://www.esri.com/news/arcuser/0112/the-importance-of-cartographic-design.html. [Link] … Continue reading
There are two basic methods of graphing data in a map:
- As a point
- As a polygon
In this example from Cline et al. (2011) [5]Kevin L. Cline, Stephen A. Marlett, Hugh Paterson III, Mark L. Weathers. 2011. Las Conexiones Externas e Internas. In Los Archivos Lingüísticos Me’phaa, Ed. Stephen A. Marlett: SIL … Continue reading you can see both polygons and points. The points representing inhabited places and the polygons representing more generally the area in which the speakers live.

Map showing both polygons and points
Data points might be used to cover regions. Polygons might then be used to abstract from a series of points for clarity on a map. That is, in essence a polygon is a series of points with the same value (and the square area between these points).
A second example of polygon use is from the Etnopedia article on the A Che [6] Etnopedia Contributors. 4 May 2011. Etnopedia: A Che. http://en.etnopedia.org/wiki/index.php?title=A_Che&oldid=22017. [Link to current article] people and language in mainland China. This map is presented in the browser as a polygon layer on top of Google Maps.

Map of the A Che speaking area near Kunming China as a polygon over Google Maps
In this case the polygon is created with a series of GIS points and the code below:
<googlemap version="0.9" lat="24.627045" lon="102.128906" type="terrain" zoom="8" width="500" height="350" scale="yes" overview="yes" controls="large">

2#ADCC0000 (#ADCC0000)

24.726875, 101.980591

24.642024, 101.942139

24.55212, 101.942139

24.497146, 101.958618

24.462151, 102.052002

24.58709, 102.128906

24.801695, 102.145386

24.861519, 102.068481

24.726875, 101.980591

</googlemap>
This brief focuses on graphing language, culture and linguistic data using polygons over real geographic terrain, though some maps with points will be included.
Several categories are not represented here:
- Social network strength in speech communities
- Social identity variation
- Language attitude variation (see Waller (2009) [7]Alessia Valentini Waller. 2009. “Il Toscano Non È Un Dialetto” : Variation in Italian Language Attitudes. Thesis: Emory University. http://pid.emory.edu/ark:/25593/1b5tj [Library Page] … Continue reading for an example using choropleth maps)
- Literacy levels
- Bio-genetic markers, like x-y chromosome matching with language use (see Viereck (1998) [8] Wolfgang Viereck. 1998. Geolinguistics and haematology: the case of Britain. Links & Letters vol. 5: 167-179. http://ddd.uab.cat/pub/lal/11337397n5p167.pdf [PDF] [Accessed: 21 February 2012] for an interesting discussion on the case of Britain and blood types)
- Socio-economic data with language use overlay
- Political vs. Linguistic dialect identity
Several categories are represented here:
- Ethnolinguistic Mapping
- Language Area Mapping
- Language Family Mapping
- Anthropological Feature Mapping
- Historical Mapping
- Grammatical Feature Mapping
- Lexical Variation Mapping
- Phonological Features Mapping
- Intelligibility Mapping
- Script variation (Large scale but not on a per language bases.)
- Religion and language maps
- Population Density (as it relates to language use)
- Mapping Poly-lingualism and Mapping Diglossia
Direct mapping of language dialects is not really helpful for several reasons:
- Dialects are, or can be defined using social or political features rather than “linguistic” features. (Consider that the debate on what is a variation, a dialect, or a language can be seen as a linguistic issue or as a social, and therefore also a political issue.)
- Direct mapping of dialects also presents a level of analysis without necessarily presenting the data. The assumption here is that presenting the data is, in general is more helpful, rather than presenting an analysis, though there may also be times when presenting an analysis is more appropriate, such as the summary of a work as Labov et al. (2006) do in presenting “the dialects of American English”. [9] William Labov, S. Ash, S., & C. Boberg. 2006. Atlas of North American English. Paris: Mouton de Gruyter.
However, with this sort of map one will still need some context to determine what the differences are between the claimed dialects. I include a brief example here from Bushman 1989. [10] John H. Bushman. 1989. Exploring the Geographical Dialects of English. Language Arts Journal of Michigan 5.2: 54-61. [Link] [Accessed: 28 February 2012]
The Dialects of American English

Example of some of the differences between the Midland, North, and South Dialects of English in the U.S.
The following map of the UK shows some specific isogloss lines showing where dialects, [11]Samuel Moore, Sanford B. Meech, and Harold Whitehall. 1935. Map of Middle English dialects. In: Middle English Dialect Characteristics and Dialect boundaries. University of Michigan Press: Ann Arbor. … Continue reading depending on what is defined as a dialect, occur based on indicated features on the map (an example of presenting data).

Map of Dialects in the UK during the time Middle English was spoken


However, linguistically speaking, two dialects are distinguishable by 1 or more linguistic features. Dialects usually are distinguished on more than one feature difference. It is this combination of features which mark linguistic dialects. Again, these features could be social/ethnic, or linguistic, but if we look at only the linguistic features we would want to map things like:
- Phonological processes
- Grammaticalizations
- Particle Usage
- Discourse Features
- Vowel qualities
- Stress Patterns
- Language Use Contexts
- Syntax structures
- Clause types
- Suprasegmental phenomena
- Affix types
- Phoneme or phonetic inventories
If we map the features, then where there is a convergence of features the “natural” dialects will emerge. When there is a convergence of features but not a indigenously recognized dialect this gives us, as researchers, insight to the linguistic meta-knowledge of the speakers. That is what do they hear as a marker that someone is from a different dialect. Also by mapping will we not only know were there are dialectal differences, but also the factors dividing people into different dialects. Consider this first map of Germany [12] Werner König. 2001. dtv-Atlas Deutsche Sprache. München: Deutscher Taschenbuch Verlag. ISBN: 3-423-03025-9 . It shows what is commonly considered the dialects of German.

Map of German Dialects
But from this map we can not tell why the dialect borders are the way they are or what the differences really are. But when we overlay the German political regions over the same information and also consider some information about case markings and phonological features we start to see some very distinct reasons why the dialect borders are the way they are.

Political Map of Germany

Mapping of German demonstrative pronoun das in the Black Forest area. This is the phonological shape of a particular syntactic element.

Feature isoglosses in the Black Forest mapped to an index
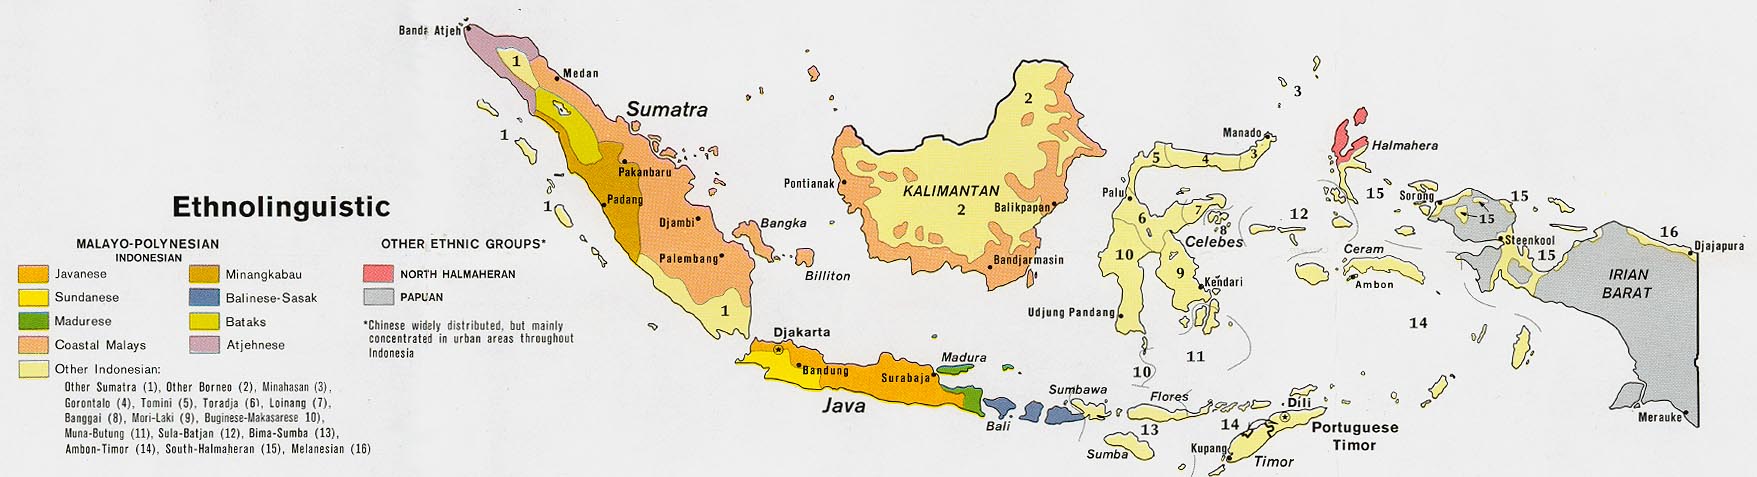
Ethnolinguistic Mapping

Ethnolinguistic Map of Indonesia from 1972
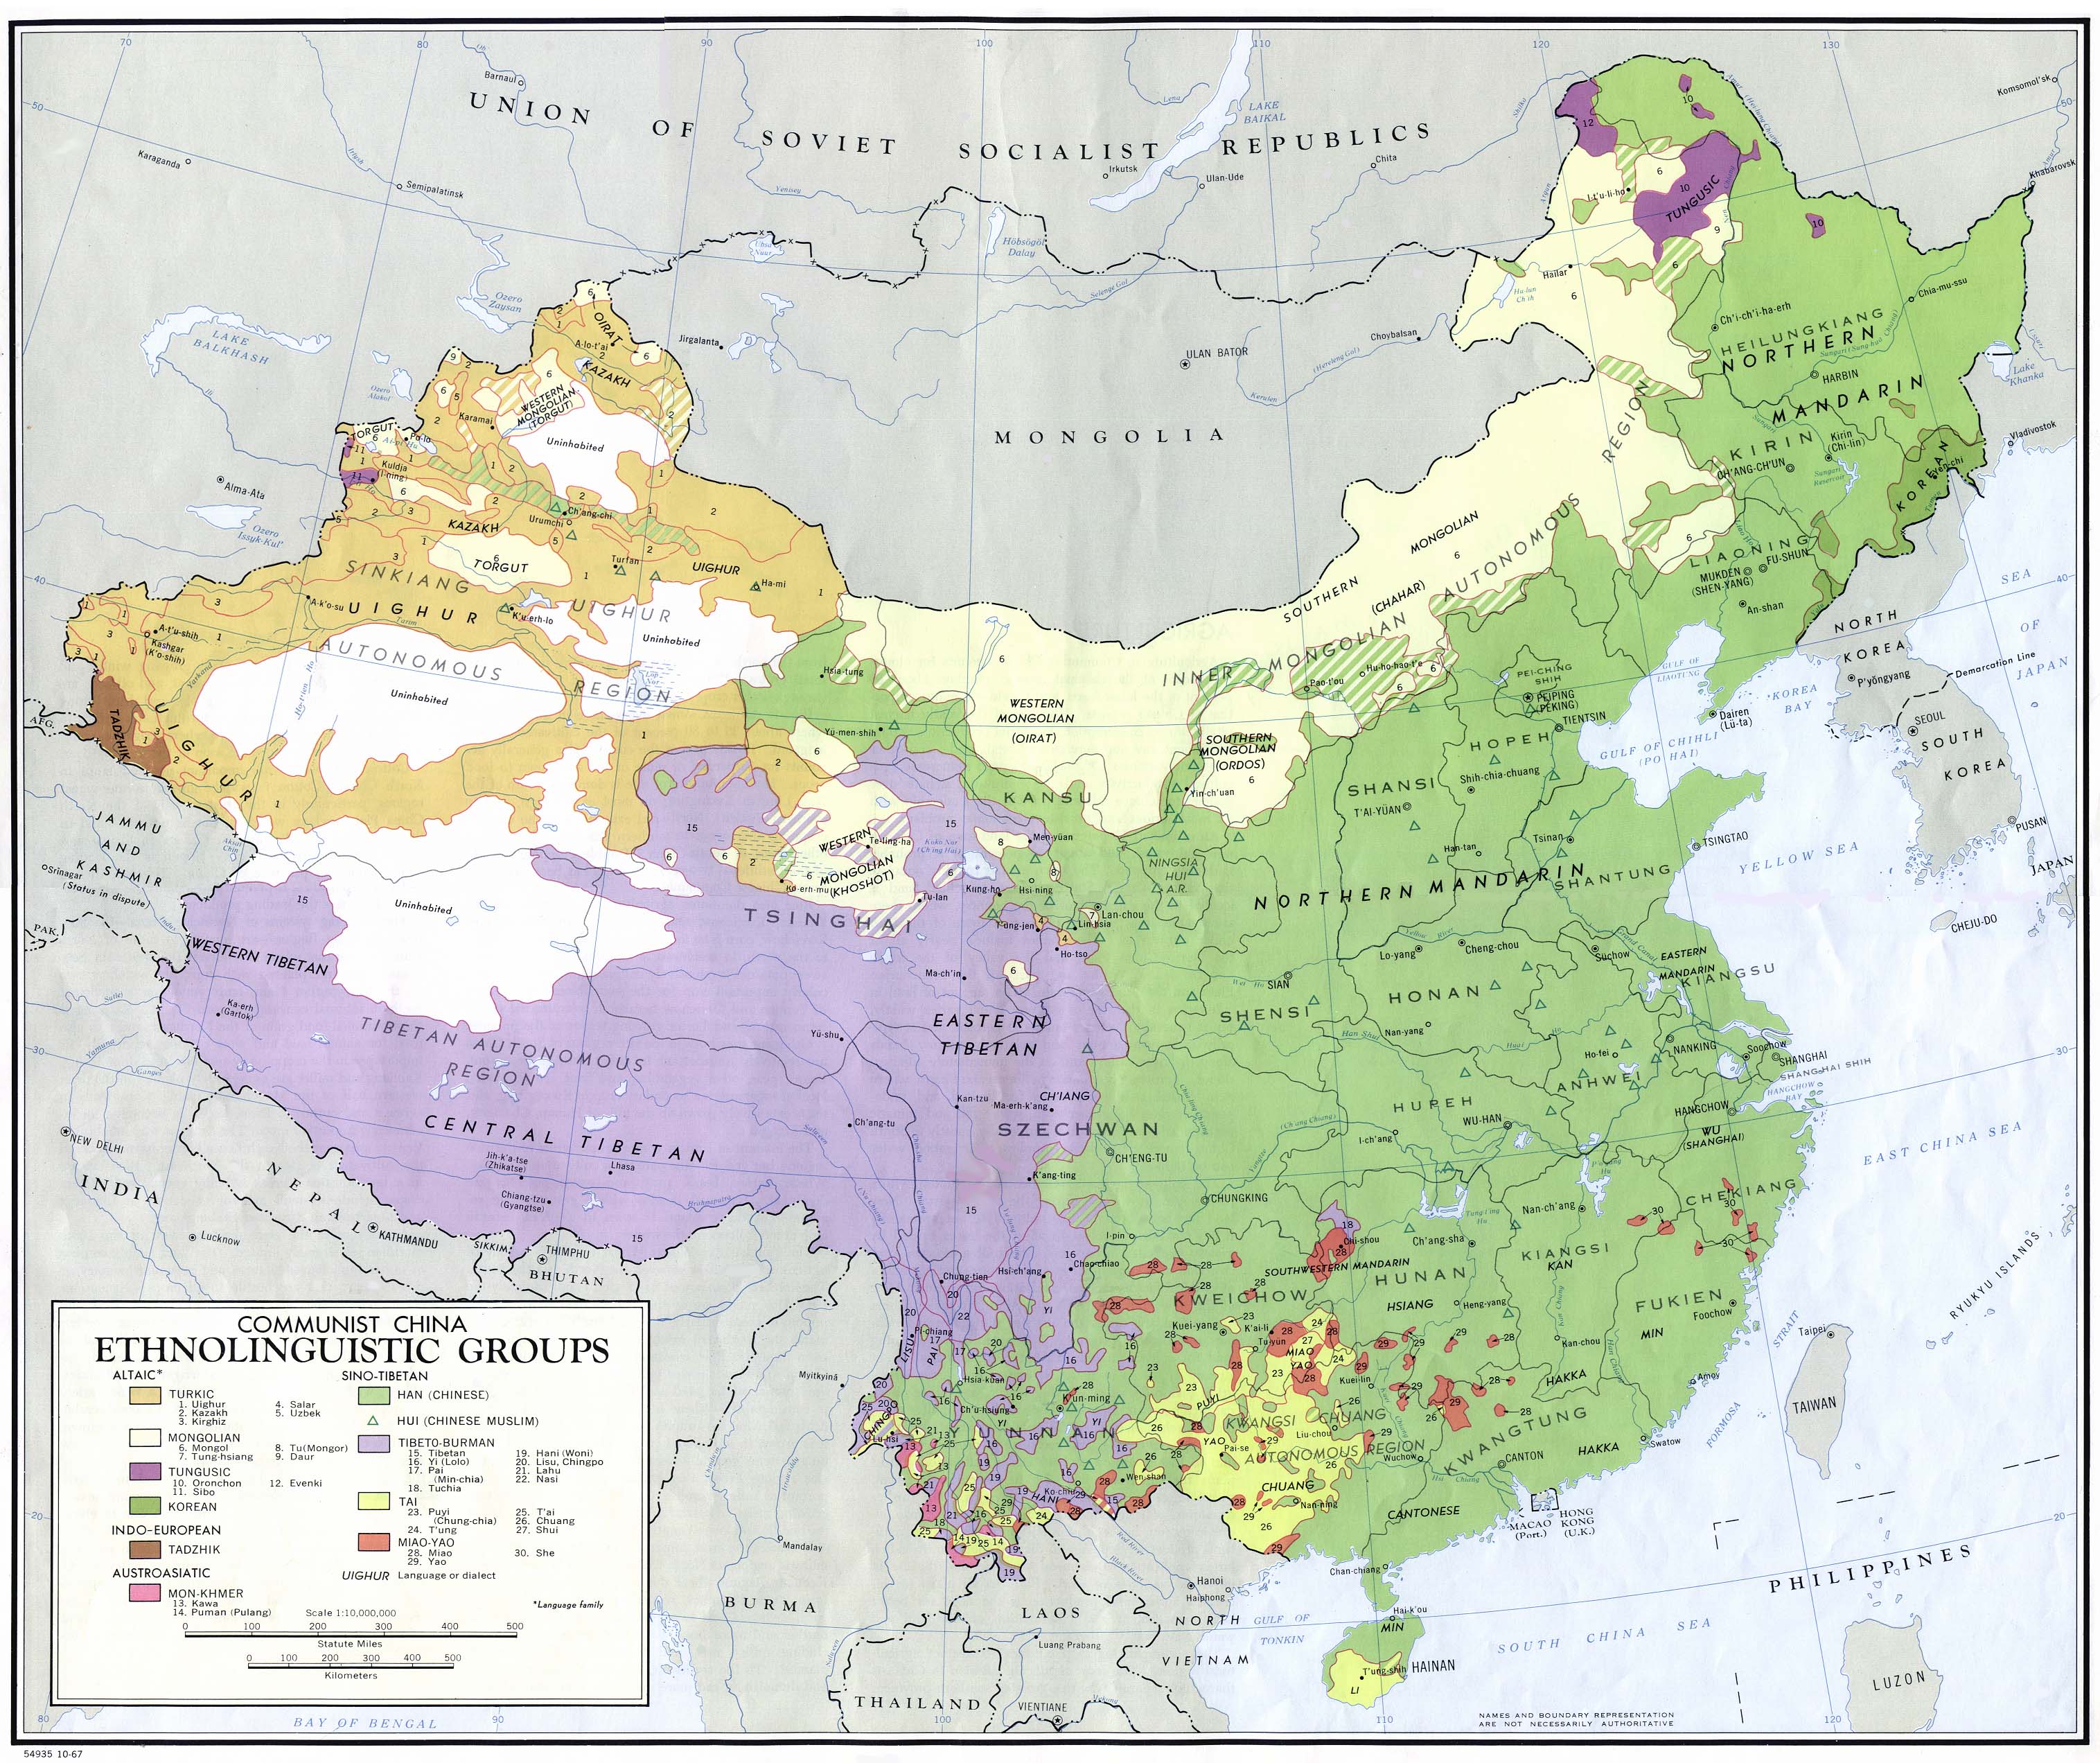
The following maps show various perspectives on ethnolinguistic knowledge and are from the University of Texas Austin Library map collection on China. The represent 1967 [15]Ethnolinguistic map of China. 1967. Ethnolinguistic Groups from Communist China Map Folio. U.S. Central Intelligence Agency, Directorate of Intelligence, Office of Basic Geographic Intelligence. … Continue reading , and 1983 [16]China – Ethnolinguistic Groups. 1983. Available from the online map collection at the Library at the University of Texas Austin. … Continue reading .

Ethnolinguistic Map from China in 1967

Ethnolinguistic Map of China from 1983
Another Way to conceive of ethnolinguistic mapping is via a percentage of the population of a given area. Many areas around the world have more than one people group making up the society interacting in it.
Here is an example of a Choropleth Map depicting the percentage of the hispanic population in the United States.

Density Map of the Hispanic Population in the USA
Ethnic maps
http://www.freelang.net/families/maps/russia-ethnic-republics-94.png
http://www.freelang.net/families/maps/russia-ethnic-plurality-82.png
Language Area Mapping
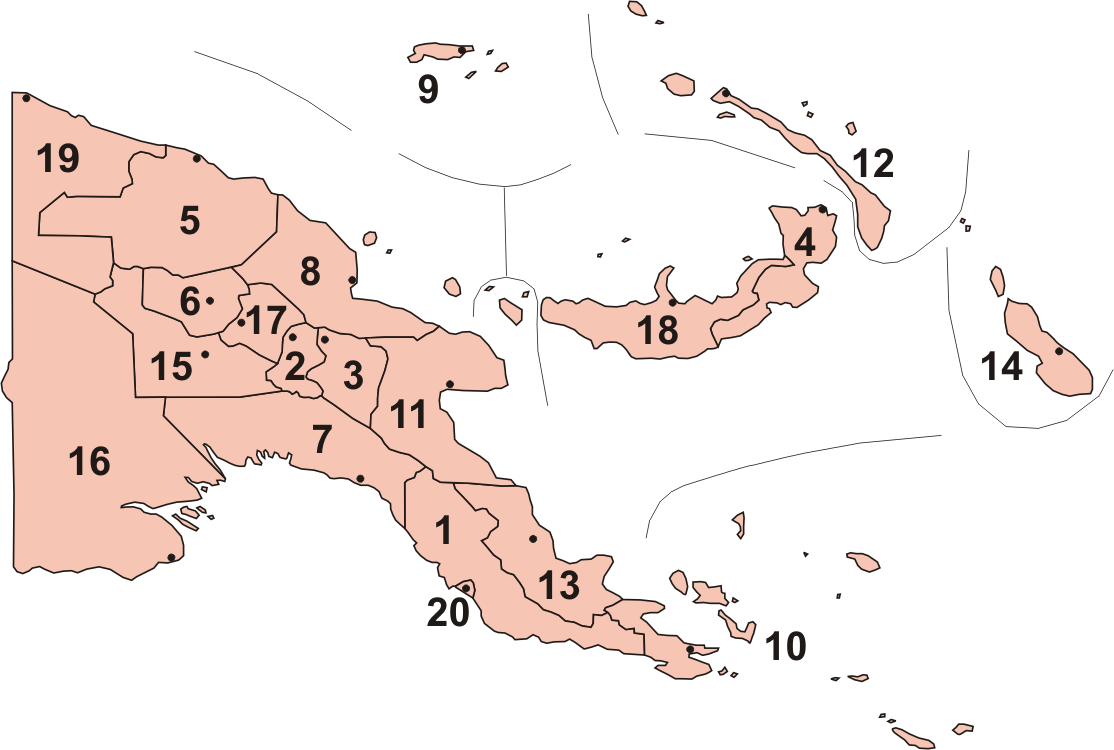
Maps can show the range of the people speaking that language. (Their territorial lands.) Obviously the ground doesn’t speak a language, people speak a language. People can move and are mobile, so these types of maps may change frequently. This map of Papua New Guinea shows the language areas for the languages spoke there [17] Muturzikiña. n.d. Map of Papua New Guinea Languages. http://www.muturzikin.com/cartesoceanie/imagesoceanie/papou1.png [Link] [Accessed 14 February 2012] .

Languages of Papua New Guinea
These maps look a lot like maps which show political boundaries (in the sense that they show distinct regions). Like the following one from Wikipedia [18]slawojar 小山 – Polish Wikipedian. 25 April 2005. Province of Papua New Guinea numbered. http://commons.wikimedia.org/wiki/File:Papua_new_guinea_provinces_(numbers).png. [Link] [Link to Main … Continue reading .
")
Provinces in Papua New Guinea
This is also the kind of language maps found in the Ethnologue [19] M. Paul Lewis, (ed.). 2009. Ethnologue: Languages of the World, 16th Edn. Dallas, Tex.: SIL International. which is well known for its detailed language maps. [20]Collins Maps. 25 June 2010. The BCS John C. Bartholomew Award 2010 Winner. http://blog.collinsmaps.com/2010/06/bcs-john-c-bartholomew-award-2010.html . [Link] [Accessed: 27 February 2012] Ethnologue: … Continue reading

Western Central Mexico from the Ethnologue
Language Family Mapping
The above map about showing the languages of Papua New Guinea does make an attempt to differentiate language family by changing the color used to show a relationship between the polygons. Colors or patterns are often used to show these kinds of relationships.
The map below [21]Nicholas Hopkins and Kathryn Josserand. 2005. está basado en mapas por R. Longacre en Handbook of Middle American Indians, Vol. 5 (1967), y datos de Lyle Campbell en The Linguistics of Southeast … Continue reading shows variation in language family without actually looking at the individual languages.

Meso-American Native Languages Map

Langauge Families in Mexico
Anthropological Feature Mapping

This map of language groups in the Baja comes from a book on burial practices. [22] Citation needed. I am not sure where I got this map from. So we can map Anthropological features of people groups; groups which speak a language or a variety of languages. (Another Baja burial article with a map is Laylander (2011) [23] Don Laylander. 2011. Ancestors, Ghosts, and Enemies in Prehistoric Baja California. Journal of California and Great Basin Anthropology. vol. 25.2: 169-186. [Permalink] )

Baja burial practices
Anthropological features of societies may bridge ethnic or language groups.
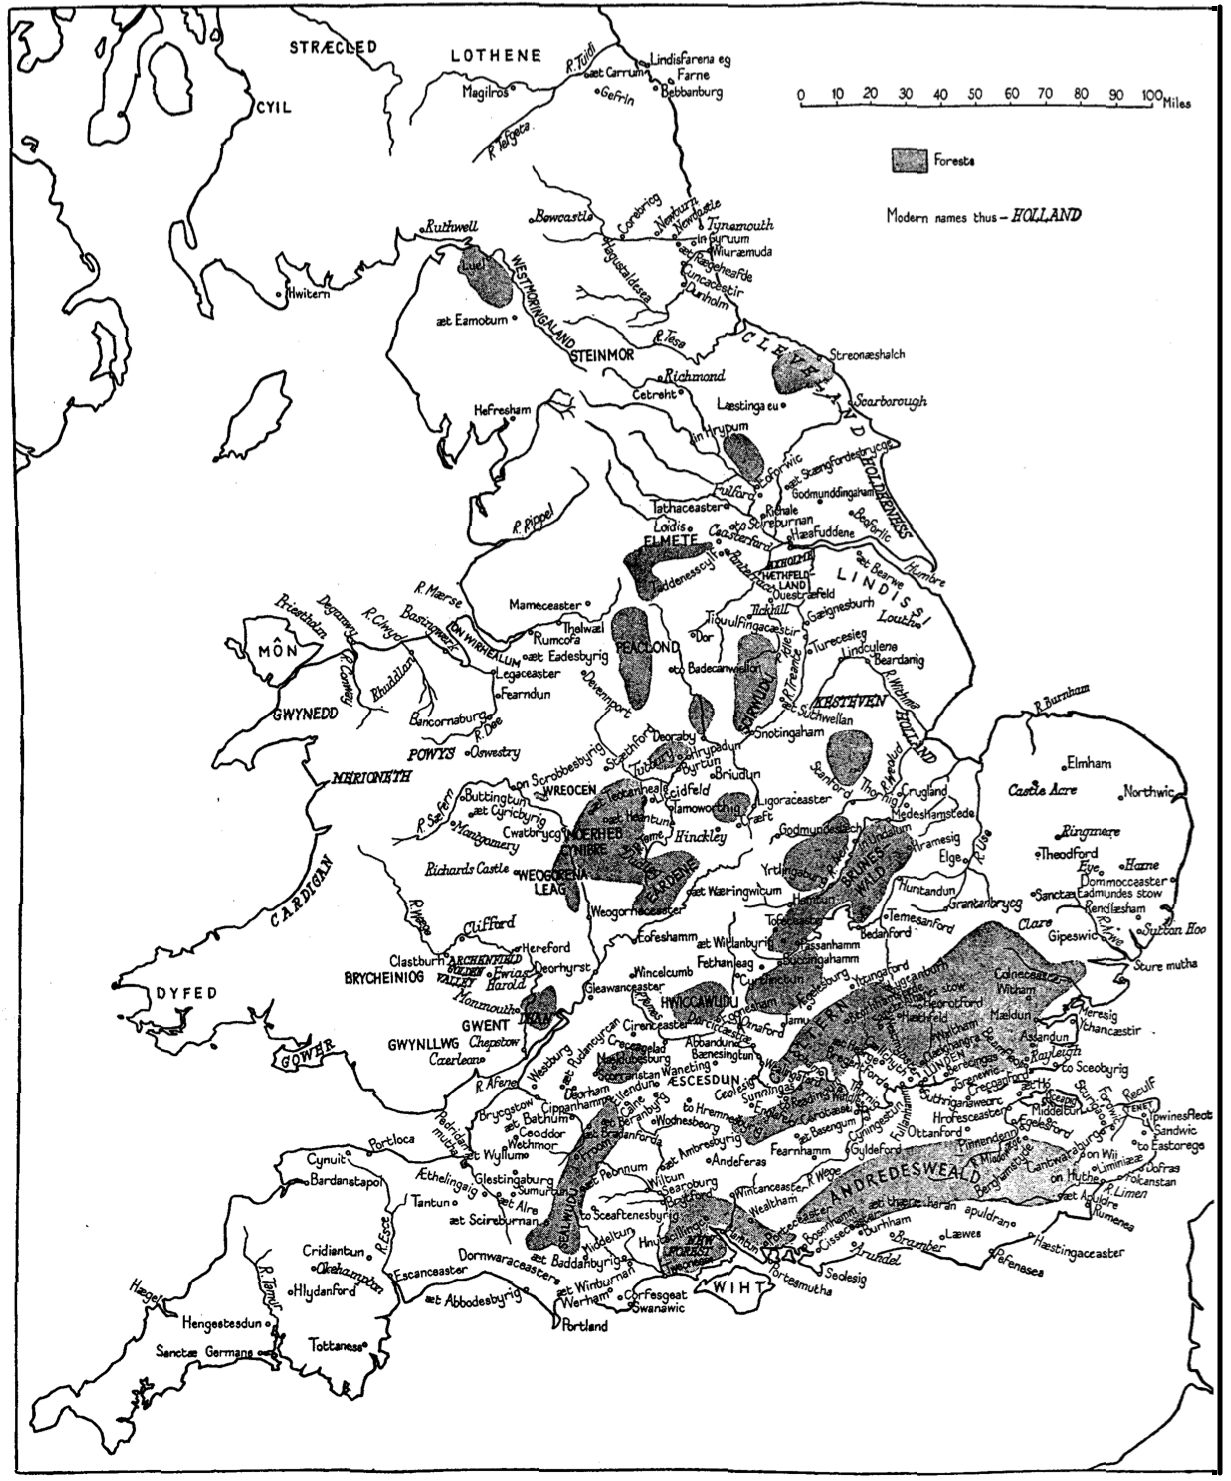
Historical Mapping
Maps can combine non-linguistic data with linguistic data.This map gives the positions and names of forests in the UK.

Map of UK forests and place names

Blow up of UK forest map
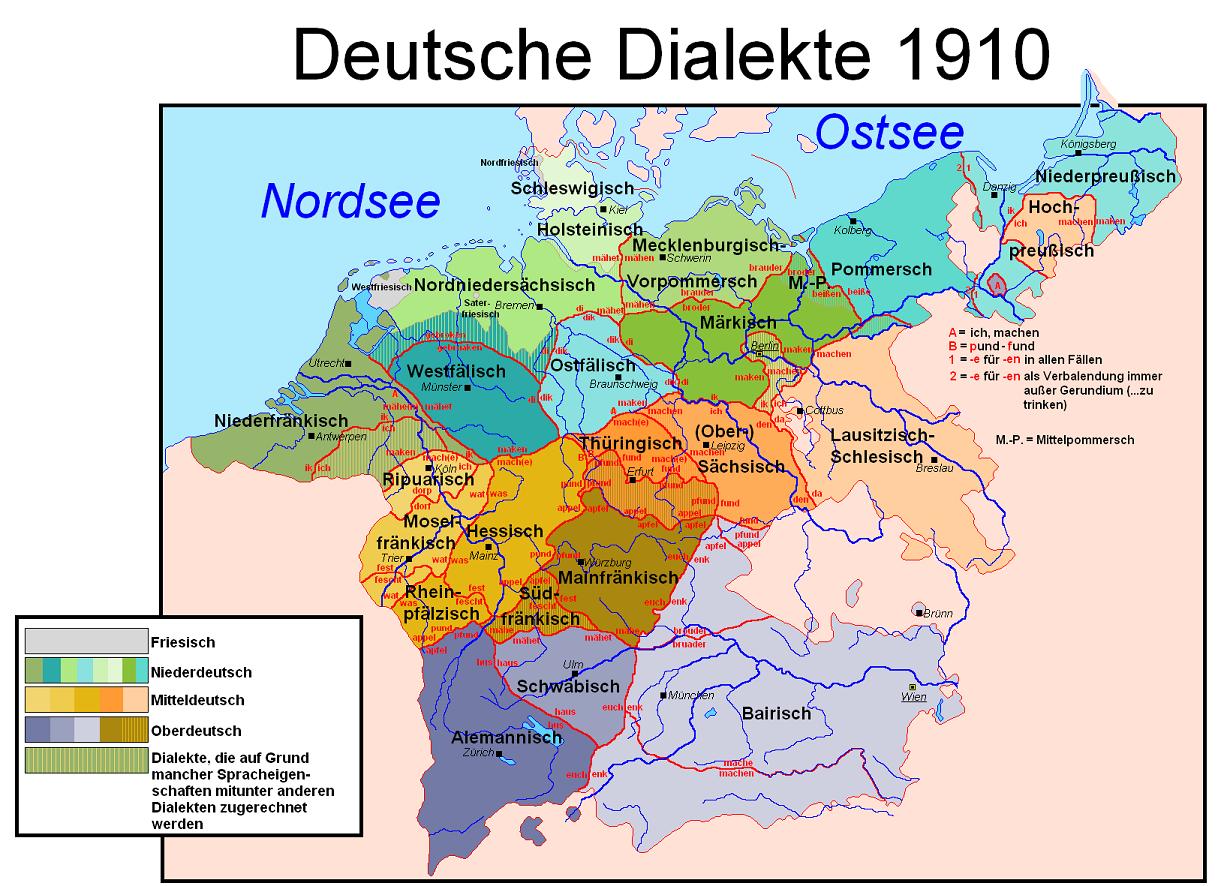
One other example of historical language depiction is this map of German dialects from 1910. [25]Map of German Dialects as of 1910. Accessed at: http://www.zonu.com/Europe/Germany/index_en.html [Link] [Accessed: 1 March 2012]

German Dialects as of 1910
Grammatical Feature Mapping
Maps can also display grammatical information. These following maps from Shrier (1965) [26] Martha Shrier. 1965. Case Systems in German Dialects. Language 41.3: 420-38. [Permalink] demonstrate how the different conflations of Nominative Case, Accusative Case and Dative Case are active for various German dialects. Some dialects show case in their definite articles, some in inflectional morphology.

Feminine Definite and indefinite articles

Extent of the N/AD Case System: Masculine items
Lexical Variation Mapping
Maps can also display lexical variation for one semantic meaning. “Pop” and “Soda” refer to the same thing but different words are used [27] Alan McConchie. 2009. Generic names of soft drinks by county. http://www.popvssoda.com/. [Link] .

Pop and Soda Map
In these particular maps the color represents a portion of the population. So, colors is used to show gradient. In language nothing happens 100% of the time, but it might happen more often than the other way, or than not. These are also examples of a choropleth maps.
Here is an example of a choropleth map showing spanish speaker density in the United States.

Spanish speaker density in the U.S.
Density Map of the Hispanic Population in the USA. This is also another example of an ethnographic map.
This is an interesting way to plot speaker densities. It works in the USA because in the USA there are well defined (and small) geographical areas like counties and zip-codes. In a country where these kinds of geographical units are not well defined using them to show population density might not work as well.
Phonological Features Mapping
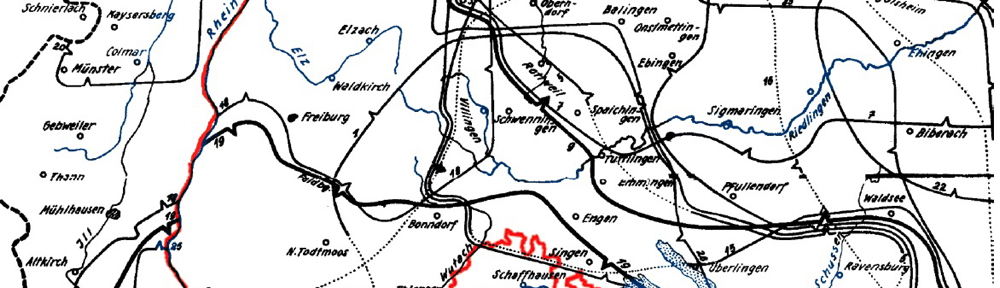
This first map by Renate Schrambke can be found in the Südwestdeutscher Sprachatlas. [29]Ewald Hall & Renate Schrambke. 1989. Lautgeographische Karten Nr. II/1.00; 1.50; 2.00-2.02; 2.50; 3.00-3.05; 3.50; 4.00; 4.50; 5.00; 5.01; 6.00-6.04; 7.00; 7.60; 8.00; 8.01; 8.60; 9.00; 9.01; … Continue reading It demonstrates a system of symbols to represent the location of a survey and then also the phonetic detail value for that location on the survey.

Map Showing Phonetic variation for the Black Forest Area
This second map shows several isogloss lines which can be either lexical, or phonological or grammatical.

Grammatical, Lexical and Phonological isogloss lines for German in High Alemannic
This last map of several languages in the Philippines, I put together over a base layer pulled from the Ethnologue [30] Raymond G. Gordon Jr., (ed.). 2005. Ethnologue: Languages of the world, 15th edn. Dallas, Texas: SIL International. in 2006. The map does not try and display features because there is no data at a grand scale available, but rather pulls together and highlights (in red) the languages with a common phonological/phonetic/phonemic feature as described in Olson et al. (2010). [31]Kenneth S. Olson, Jeff Mielke, Josephine Sanicas-Daguman, Carol Jean Pebley & Hugh J. Paterson III. 2010. The phonetic status of the (inter)dental approximant. Journal of the International … Continue reading

A Map showing the distribution of languages with the interdental approximant as described by Olson et al.
Intelligibility Mapping
“Mutual Intelligibility” is an issue which carries its own set of challenges. The basic idea for mapping mutual intelligibility is to graph how much, in terms of a percentage, what one speaker understands of another speaker’s speech. But the challenges for mutual intelligibility lie in how one defines the term and how one teases apart the analysis for intelligibility. It is the nitty-gritty questions like: What is Mutual Intelligibility? What is unintelligibility? Why is it unintelligible? Are the causes for not comprehending the speech linguistic factors or social factors? How is meaning negotiated face to face? How is meaning negotiated through a audio-aural message? We can map the results of intelligibility tests, but do these tests also identify the causes for a lack of intelligibility? This is where mapping linguistic features is probably more revealing than mapping intelligibility scores, because intelligibility is actually mapping an analysis rather than mapping data.
Nevertheless, one way intelligibility has been mapped by SIL in Mexico [32]Steven Egland, Doris Bartholomew, Saúl Cruz Ramos. 1978. La inteligibilidad interdialectal de las lenguas indígenas de México: Resultado de algunos sondeos, Instituto Lingüístico de Verano. … Continue reading is the following:

Mutual Intelligibility Maps
In these maps we can see where there is a gradient of intelligibility. Each isogloss line after the inner most line represents 5% loss in intelligibility (the first line is 10%). But what we can not determine from these maps is why. Are there geographical factors contributing to isolation? Are there economical factors at play and to what extent?

Mutual Intelligibility map
Script variation
SIL’s Non-Roman Script Initiative has created this map showing various script usage around the world.

Font Faces of Scripts used around the world
Religion and language maps
Religion is also know to have a role in language use and the creation of third place social environments. Being able to overlay religious facts with language use facts reveals interesting stories of language vitality, culture, and potential significant influences on the social make up of the language us setting.

Mapping Evangelical Christianity in Afganistan

Bible translation status in Afganistan by Language
Population Density
Other Resources: [33] Generating and mapping population density surfaces within a geographical information system Authors: Langford, M.; Unwin, D. J. June 1994. Source: The Cartographic Journal. vol. 31.1: 21-26(6) [Link]
Mapping Poly-lingualism and Mapping Diglossia

Kenya Dialect Map
Interactive Mapping and several special kinds of Maps
Market heat maps
http://growinginclusivemarkets.org/media/heatmaps/market_heat_map_primer.pdf
Technical notes
http://growinginclusivemarkets.org/media/heatmaps/market_heat_map_technical_note.pdf
Cartography by Mark Rosenfelder (whose eyes still hurt)
http://www.zompist.com/Langmaps.html
http://www.zompist.com/ielang.gif
http://www.zompist.com/nonielng.gif
Chotopleth maps
http://www.gitta.info/ThematicCart/en/html/TypogrDesign_learningObject4.html
http://geographyfieldwork.com/DataPresentationMappingTechniques.htm
http://www.turboperl.com/dcmaps.html
This example is one where a user can create a Chotopleth map based on a variety of data sets from the U.S. government.

Dynamic Choropleth maps

http://www.freelang.net/families/language_maps.php
California maps
http://linguistics.berkeley.edu/~survey/languages/language-map.php

Language areas in Califorina
http://webspace.ship.edu/cgboer/languagefamilies.html
http://www.esri.com/news/arcuser/0206/language_ms1of2.html
http://www.india-reports.com/summary/map-languages-in.aspx#h
http://linguistics.buffalo.edu/people/faculty/dryer/dryer/family.maps
Interactive Cartography
http://sedac.ciesin.columbia.edu/gpw/wps.jsp
http://education.nationalgeographic.com/education/mapping/interactive-map/?ar_a=1
LL-Map
Kaufman, Terrence, Stephanie Koerner, et al. 2007. Meso-America. Atlas of the World’s Languages, ed. by R. E. Asher and Christopher Moseley, 56. Oxford: Routledge.
Date Digitized: 17 June 2011
Map Description:
The areas pictured display locations where the Mayan subgroup languages were spoken when European explorers first encountered them. As specified by Asher and Moseley, the time of contact varied for each language; most of the coastal languages were first identified during the 16th and 17th centuries, although some languages in the interior of South America became known much later, during the 20th century (Asher, Moseley et al).
This original map was made by vectorizing data from the MultiTree language database and the Altas of the World’s Languages. http://llmap.org/maps/215136.html
———-
Linguistics 310 History of English
Syllabus
Spring 2009
Something:
http://www.baruch.cuny.edu/wsas/academics/modern_languages/THEAMERICANSOCIETYOFGEOLINGUISTICS.htm
Geolinguistics: The Incorporation of Geographic Information Systems and Science. [34] Shawn Hoch & James J. Hayes. 2010. Geolinguistics: The Incorporation of Geographic Information Systems and Science. The Geographical Bulletin. vol. 51(1): 23-36. [PDF] [Accessed: 21 February 2012] shows some interesting charts for clustering data and mapping the same data.
Geo-lingusitic vs. Socio-linguistic factors compared for a geo-linguistic atlas [35]Gotzon Aurrekoetxea, Jose Luis Ormaetxea. 2006 Research project – Socio-geolinguistic atlas of the Basque language. Euskalingua. vol. 9: 157-162. … Continue reading
http://www.springerlink.com/content/jr70v35l1w783t04/
http://www.continuitas.org/texts/alinei_geolinguistic.pdf
http://www.digitalhimalaya.com/projectteam/turin/downloads/geolinguistics_1.pdf
http://conference.osu.eu/globalization/publ/06-cerny.pdf
http://www.mappinglanguage.com/2011/04/19/content-based-generation-of-language-maps/
http://proceedings.esri.com/library/userconf/proc04/abstracts/a1071.html
http://www.mappinglanguage.com/
http://www.worldgeodatasets.com/language/huffman
Presenting language in maps [36] Östen Dahl & Ljuba Veselinova. 2006. Language Map Server. In Proceedings of the 25th International User Conference, ESRI. San Diego: ESRI Press. [Link] [Accessed: 21 February 2012]
Researchers need the whole picture not just the Language Area

U.N. Human Poverty Index for Nepal

U.N. Chronic Malnourishment Below 5 years old

Topographical Map of Nepal

Map of Ethnic Groups in Nepal

Political zones in Nepal
http://www.freelang.net/families/maps/caucasus-ethnolinguistic-groups.png
http://www.freelang.net/families/maps/caucasus-ethnic-plurality.png
Some really cool resources
Articles
[37] William A. Kretszchmar Jr. 1996. Quantitative areal analysis of dialect features.
Language Variation and Change. vol. 8.1: 13-39 DOI: 10.1017/S0954394500001058
Journals
Books
References
| ↑1 | Hugh Paterson III. 10 November 2011. Diving into the UX World. Blog post on thejourneyler.org. https://hugh.thejourneyler.org/2011/diving-into-the-ux-world/. [Link] [Accessed: 27 February 2012] |
|---|---|
| ↑2 | ESRI. 2012. Less is more. Winter 2012 Edition of ArcUser. http://www.esri.com/news/arcuser/0112/less-is-more.html. [Link] [PDF] [Accessed: 27 February 2012] |
| ↑3 | Aileen Buckley. 2012. Make Maps People Want to Look At. Winter 2012 Edition of ArcUser. http://www.esri.com/news/arcuser/0112/make-maps-people-want-to-look-at.html. [Link] [PDF] [Accessed: 27 February 2012] |
| ↑4 | Karen Richardson. 2012. The Importance of Cartographic Design in the SDI environment. Winter 2012 Edition. http://www.esri.com/news/arcuser/0112/the-importance-of-cartographic-design.html. [Link] [PDF] |
| ↑5 | Kevin L. Cline, Stephen A. Marlett, Hugh Paterson III, Mark L. Weathers. 2011. Las Conexiones Externas e Internas. In Los Archivos Lingüísticos Me’phaa, Ed. Stephen A. Marlett: SIL International. Retrieved from http://www.sil.org/mexico/workpapers/WP013- PDF/MephaaConexiones.pdf [PDF] [Accessed: 21 February 2012] |
| ↑6 | Etnopedia Contributors. 4 May 2011. Etnopedia: A Che. http://en.etnopedia.org/wiki/index.php?title=A_Che&oldid=22017. [Link to current article] |
| ↑7 | Alessia Valentini Waller. 2009. “Il Toscano Non È Un Dialetto” : Variation in Italian Language Attitudes. Thesis: Emory University. http://pid.emory.edu/ark:/25593/1b5tj [Library Page] [Accessed: 21 February 2012] |
| ↑8 | Wolfgang Viereck. 1998. Geolinguistics and haematology: the case of Britain. Links & Letters vol. 5: 167-179. http://ddd.uab.cat/pub/lal/11337397n5p167.pdf [PDF] [Accessed: 21 February 2012] |
| ↑9 | William Labov, S. Ash, S., & C. Boberg. 2006. Atlas of North American English. Paris: Mouton de Gruyter. |
| ↑10 | John H. Bushman. 1989. Exploring the Geographical Dialects of English. Language Arts Journal of Michigan 5.2: 54-61. [Link] [Accessed: 28 February 2012] |
| ↑11 | Samuel Moore, Sanford B. Meech, and Harold Whitehall. 1935. Map of Middle English dialects. In: Middle English Dialect Characteristics and Dialect boundaries. University of Michigan Press: Ann Arbor. http://www.ling.upenn.edu/~kroch/courses/lx310/ringe-handouts-09/mideng-dialect-map.png [Link] [Accessed: 28 February 2012] acquired via Don Ringe through Anthony Kroch. |
| ↑12 | Werner König. 2001. dtv-Atlas Deutsche Sprache. München: Deutscher Taschenbuch Verlag. ISBN: 3-423-03025-9 |
| ↑13 | Hubert Klausmann, Renate Schrambke, and Konrad Kunze. 1997. Kleiner Dialektatlas: Alemannisch und Schwäbisch in Baden-Württemberg. Bühl: Konkordia Verlag. |
| ↑14 | Indonesia – Ethnolinguistic from Map No. 500869. 1972. Available from the online map collection at the Library at the University of Texas Austin. http://www.lib.utexas.edu/maps/middle_east_and_asia/indonesia_ethno_1972.jpg [Accessed: 29 January 2012] [Link] |
| ↑15 | Ethnolinguistic map of China. 1967. Ethnolinguistic Groups from Communist China Map Folio. U.S. Central Intelligence Agency, Directorate of Intelligence, Office of Basic Geographic Intelligence. Available from the online map collection at the Library at the University of Texas Austin. http://www.lib.utexas.edu/maps/middle_east_and_asia/china_ethnolinguistic_1967.jpg [Link] [Accessed: 29 January 2012] |
| ↑16 | China – Ethnolinguistic Groups. 1983. Available from the online map collection at the Library at the University of Texas Austin. http://www.lib.utexas.edu/maps/middle_east_and_asia/china_ethnolinguistic_83.jpg [Link] [Accessed: 29 January 2012] |
| ↑17 | Muturzikiña. n.d. Map of Papua New Guinea Languages. http://www.muturzikin.com/cartesoceanie/imagesoceanie/papou1.png [Link] [Accessed 14 February 2012] |
| ↑18 | slawojar 小山 – Polish Wikipedian. 25 April 2005. Province of Papua New Guinea numbered. http://commons.wikimedia.org/wiki/File:Papua_new_guinea_provinces_(numbers).png. [Link] [Link to Main PNG article.] [Accessed: 14 February 2012] |
| ↑19 | M. Paul Lewis, (ed.). 2009. Ethnologue: Languages of the World, 16th Edn. Dallas, Tex.: SIL International. |
| ↑20 | Collins Maps. 25 June 2010. The BCS John C. Bartholomew Award 2010 Winner. http://blog.collinsmaps.com/2010/06/bcs-john-c-bartholomew-award-2010.html . [Link] [Accessed: 27 February 2012] Ethnologue: Languages of the World, Sixteenth Edition. Commended by the bestower s of the John C Bartholomew Award |
| ↑21 | Nicholas Hopkins and Kathryn Josserand. 2005. está basado en mapas por R. Longacre en Handbook of Middle American Indians, Vol. 5 (1967), y datos de Lyle Campbell en The Linguistics of Southeast Chiapas (1988). [Accessed: 29 January 2012] [Link] |
| ↑22 | Citation needed. I am not sure where I got this map from. |
| ↑23 | Don Laylander. 2011. Ancestors, Ghosts, and Enemies in Prehistoric Baja California. Journal of California and Great Basin Anthropology. vol. 25.2: 169-186. [Permalink] |
| ↑24 | Sir Frank Stenton. 1971. Anglo-Saxon England, 3rd ed. Oxford, Clarendon Press. [Accessed: 29 January 2012] [Link] |
| ↑25 | Map of German Dialects as of 1910. Accessed at: http://www.zonu.com/Europe/Germany/index_en.html [Link] [Accessed: 1 March 2012] |
| ↑26 | Martha Shrier. 1965. Case Systems in German Dialects. Language 41.3: 420-38. [Permalink] |
| ↑27 | Alan McConchie. 2009. Generic names of soft drinks by county. http://www.popvssoda.com/. [Link] |
| ↑28 | John Dorr. 2 February 2012. Illinois Institute of Technology: Paul V. Galvin Library. Diversity & inclusion blog. http://guides.library.iit.edu/content.php?pid=146626&sid=1247475 [Link] |
| ↑29 | Ewald Hall & Renate Schrambke. 1989. Lautgeographische Karten Nr. II/1.00; 1.50; 2.00-2.02; 2.50; 3.00-3.05; 3.50; 4.00; 4.50; 5.00; 5.01; 6.00-6.04; 7.00; 7.60; 8.00; 8.01; 8.60; 9.00; 9.01; 9.60; 19.00-19.05. In: Hugo Steger, Eugen Gabriel, Volker Schupp (Hrsg.): Südwestdeutscher Sprachatlas. 1. Lieferung. Marburg. |
| ↑30 | Raymond G. Gordon Jr., (ed.). 2005. Ethnologue: Languages of the world, 15th edn. Dallas, Texas: SIL International. |
| ↑31 | Kenneth S. Olson, Jeff Mielke, Josephine Sanicas-Daguman, Carol Jean Pebley & Hugh J. Paterson III. 2010. The phonetic status of the (inter)dental approximant. Journal of the International Phonetic Association 40.02: 199-215. DOI: 10.1017/S0025100309990296 |
| ↑32 | Steven Egland, Doris Bartholomew, Saúl Cruz Ramos. 1978. La inteligibilidad interdialectal de las lenguas indígenas de México: Resultado de algunos sondeos, Instituto Lingüístico de Verano. Mexico City: Instituto Lingüístico de Verano. http://sil.org/mexico/sondeos/G038b-SondeosInteligibilidad.pdf [PDF] [Accessed: 29 January 2012] |
| ↑33 | Generating and mapping population density surfaces within a geographical information system Authors: Langford, M.; Unwin, D. J. June 1994. Source: The Cartographic Journal. vol. 31.1: 21-26(6) [Link] |
| ↑34 | Shawn Hoch & James J. Hayes. 2010. Geolinguistics: The Incorporation of Geographic Information Systems and Science. The Geographical Bulletin. vol. 51(1): 23-36. [PDF] [Accessed: 21 February 2012] |
| ↑35 | Gotzon Aurrekoetxea, Jose Luis Ormaetxea. 2006 Research project – Socio-geolinguistic atlas of the Basque language. Euskalingua. vol. 9: 157-162. http://www.mendebalde.com/modulos/usuariosFtp/conexion/archi322A.pdf [PDF] |
| ↑36 | Östen Dahl & Ljuba Veselinova. 2006. Language Map Server. In Proceedings of the 25th International User Conference, ESRI. San Diego: ESRI Press. [Link] [Accessed: 21 February 2012] |
| ↑37 | William A. Kretszchmar Jr. 1996. Quantitative areal analysis of dialect features. Language Variation and Change. vol. 8.1: 13-39 DOI: 10.1017/S0954394500001058 |
Hello! I am interested in the origin of one of the maps you posted, specifically the one of isoglosses in the Black Forest region. The reason is that I have a map, also in German, of the Banat region and this map has very similar styling, both in terms of font, colors, and marking of geographic features, but I do not know where my map is from. I am wondering if they might have the same source and am looking to investigate if that is the case by learning more about the map you posted. Thanks for any information and take care.
I looked around for a “Banat Sprachatlas” and I used Google Image search to look for similar maps. I don’t specifically see the kind of map you emailed me which had at least two features indicated via pie charts. There is quite a large academic literature on the German speaking populations and their history in the Banat region. I would estimate the date of publication to be between 1970 and 1990 based on the use of pie charts in the map you sent. You might consider: German, English, Russian, and Romanian Publications. I see scholarly publications in each of these languages.